The best free spectrum analyser plugins, and how to set one up
Four free spectrum analyser plugins compared on block size, slope, mid/side, metering and comparing two tracks, plus the settings that make one tell the truth.
By CrystalKarat10 min read
A spectrum analyser doesn’t mix for you, but it settles arguments your room and your ears can’t: whether that low end is really there, whether the vocal’s harshness is at 3 or 5 kHz, whether your master has twice the sub of the reference. You don’t need to pay for one. Here are the free analysers worth installing, what to look for, and how to set one up so it tells you the truth.
Quick picks
- 01SoapCrystalKaratComparing a track with the rest of the mix, in frequency and stereo positionFree
- 02SPANVoxengoThe standard free analyser, with the deepest meteringFree
- 03MAnalyzerMeldaProductionDeep analysis options from a big free bundleFree
- 04FreqAnalystBlue Cat AudioA simple, smooth spectrum with nothing to learnFree
What a spectrum analyser is for
- Checking what you can’t hear. Sub-bass below your monitors’ range, rumble, a DC offset, a hum at 50 or 60 Hz.
- Finding a frequency. The ring in a snare, the resonance in a vocal, the kick’s fundamental: the analyser gives you a number to start the EQ at.
- Comparing. Your mix against a reference track, or one track against the rest of the mix. Comparing is where an analyser earns its place, because it shows differences your ear has stopped noticing.
What matters in a free analyser
| Feature | Why it matters |
|---|---|
| Adjustable block size | Larger blocks resolve the low end; smaller ones respond faster |
| Slope | Tilts the display so a balanced mix reads roughly flat |
| Smoothing | Fractional-octave smoothing shows tonal balance rather than every harmonic |
| Mid/side view | Shows what is in the centre and what is at the sides of the image |
| A second signal | Compares one track with another, or your mix with a reference |
| Metering | Loudness (LUFS), true peak and correlation, so you need one plugin, not three |
The best free spectrum analysers
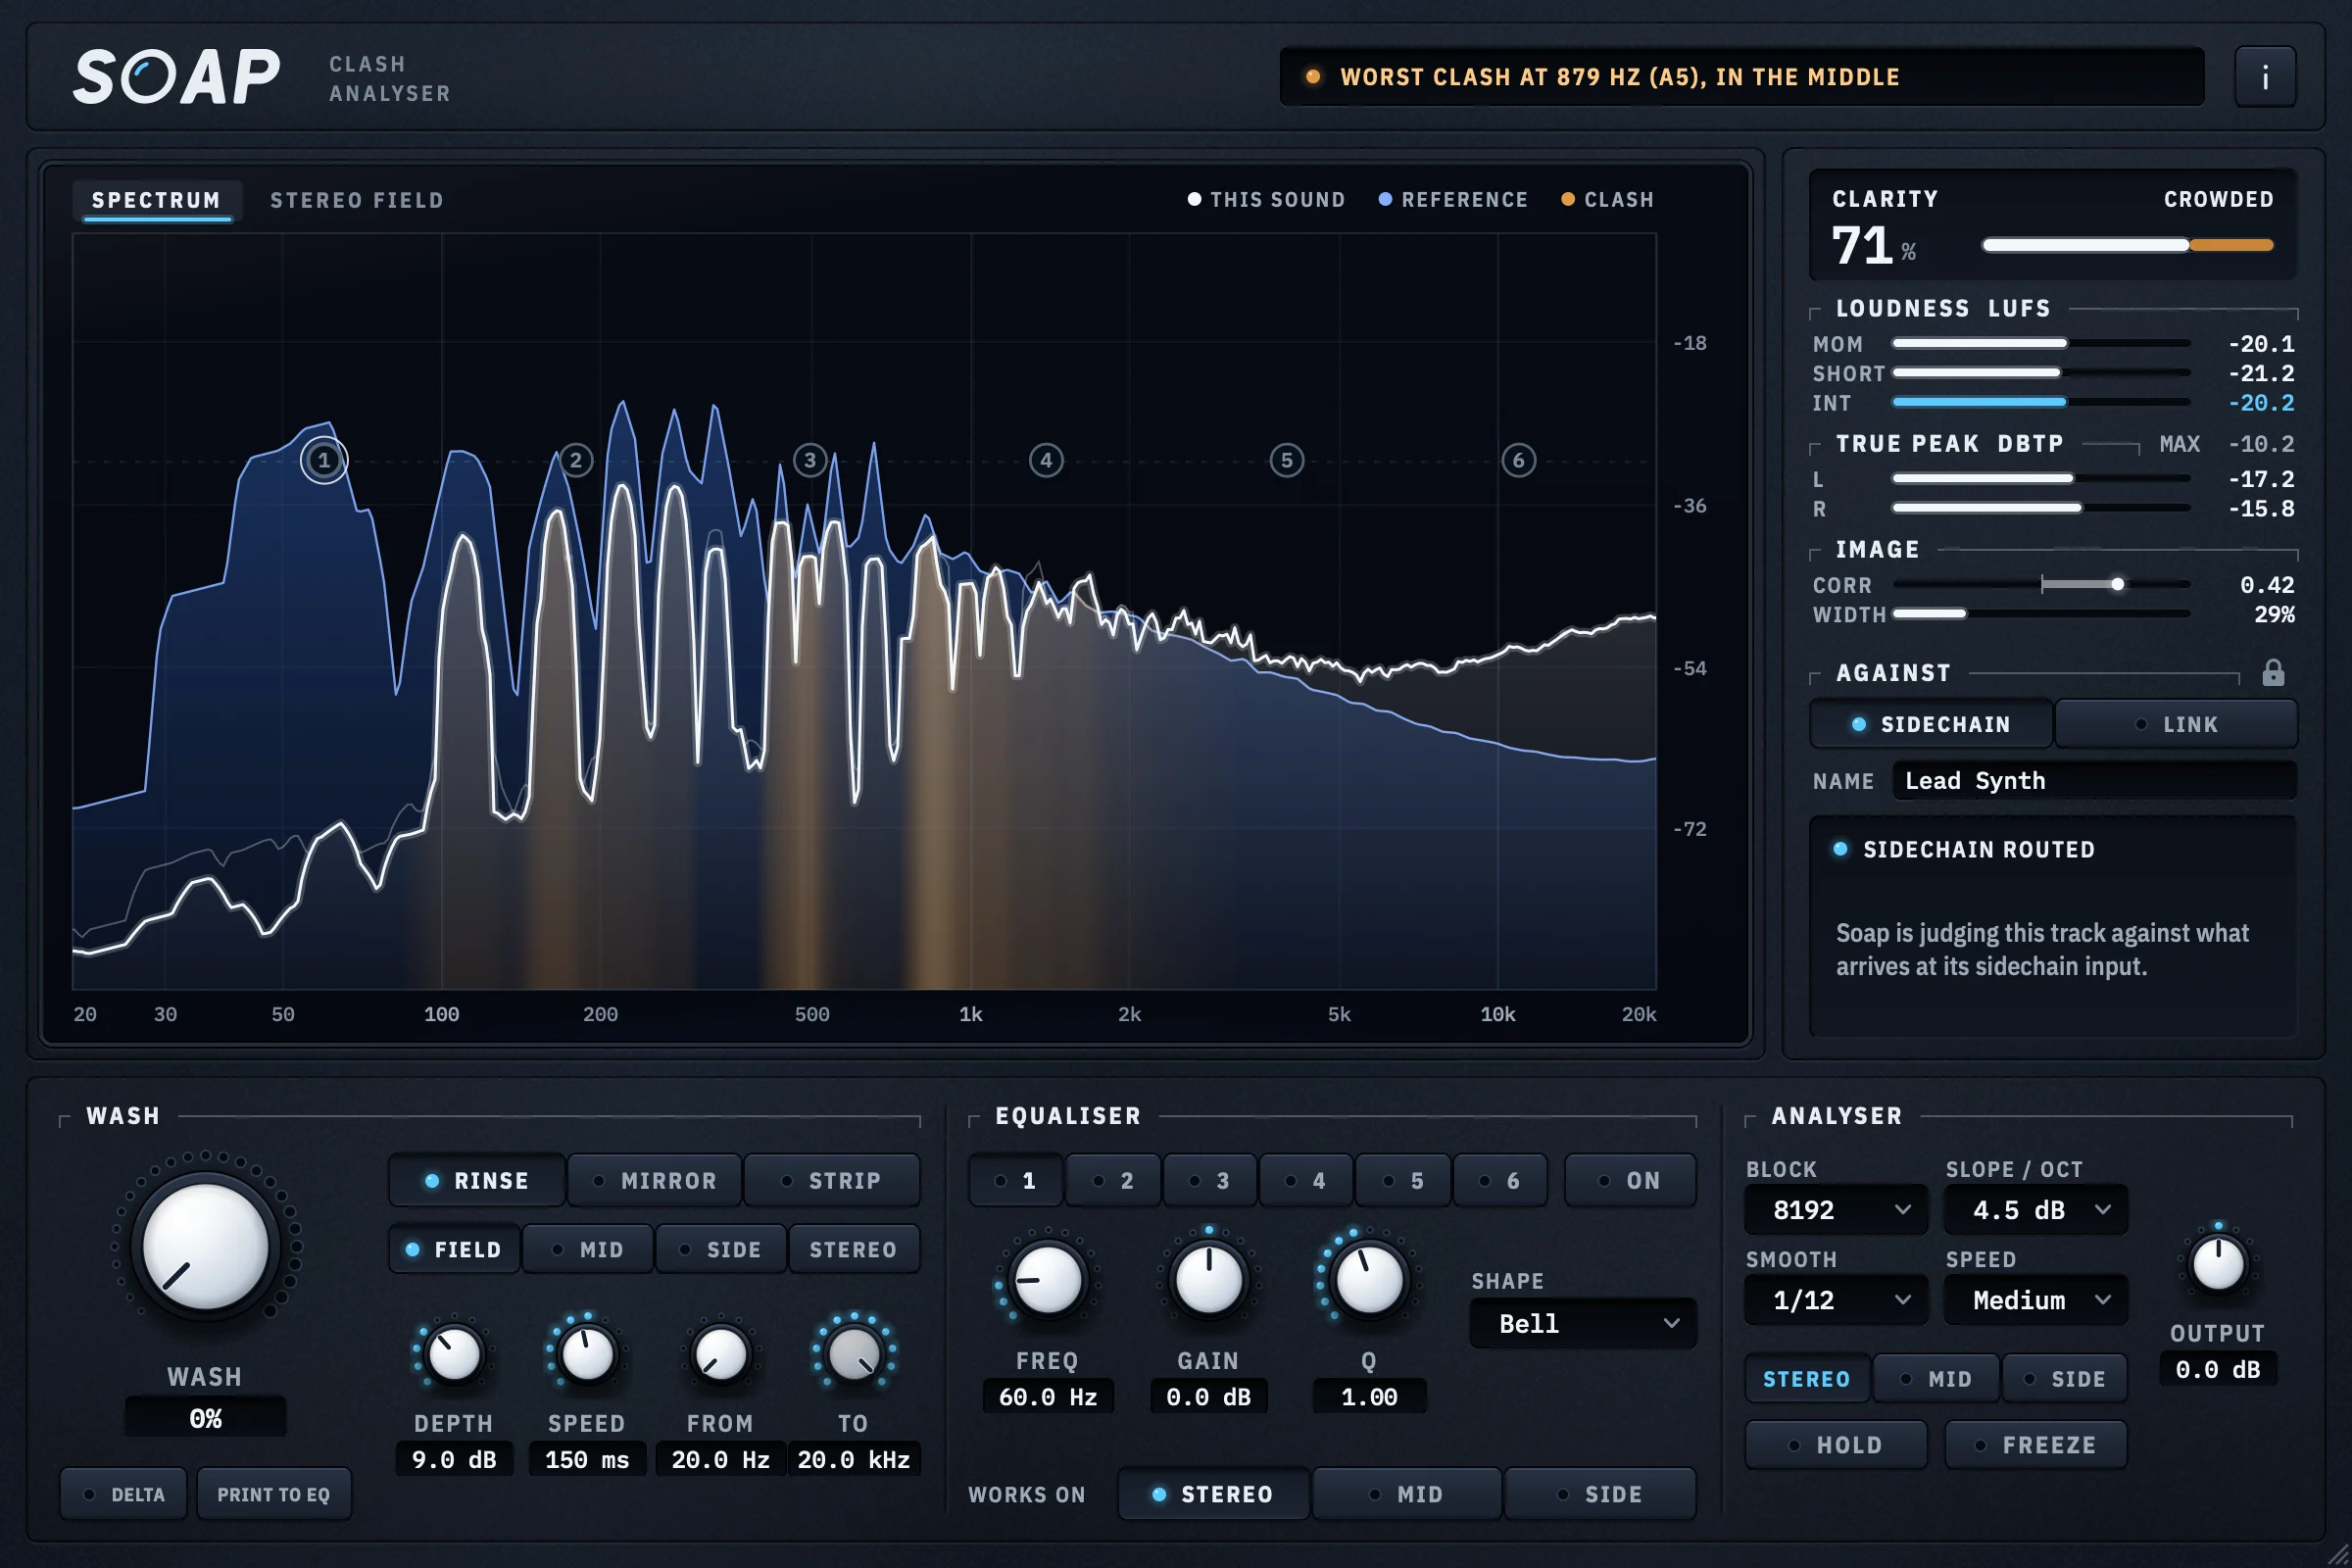
01Soapby CrystalKarat
Muddiness removerBest for: Comparing a track with the rest of the mix, in frequency and stereo position
As a plain analyser, Soap covers what most engineers use one for: an FFT spectrum from 20 Hz to 20 kHz with a block size from 2048 to 16384 points, a slope of 0, 3, 4.5 or 6 dB per octave, smoothing up to a third of an octave, three fall speeds, peak hold, freeze, and a stereo, mid or side view. Hover anywhere for the frequency, its note name and its level. Beside it are loudness to EBU R 128 (momentary, short-term and integrated), true peak with a count of overs, and correlation and width meters.
What sets it apart is the second signal. Route the rest of the mix to its sidechain and Soap draws it in blue under this track in white, fills their shared ground in amber, and adds a stereo field on the same axis, showing how wide every frequency is and where the two meet in the image. A Clarity score and a one-line header say how badly, and where. And unlike any analyser here, it can then do something about it, with the Wash and a six-band mid/side equaliser, or leave the audio bit for bit untouched.
Why pick it
- Two signals compared in frequency and in the stereo image
- R 128 loudness, true peak, correlation and width beside the spectrum
- Fixes what it finds, or passes audio untouched
- No key, no trial, no nag screen
Know first
- Mono and stereo only: no surround
- No K-system scales or level statistics, and analyser settings save with the session, not as presets
- Needs a free CrystalKarat account to download
- Price
- Free, with a CrystalKarat account · Link with Studio Pass
- Formats
- Windows VST3 · macOS VST3 and AU
Soap is ours: CrystalKarat makes it and publishes this blog. Everything else on this list is another company's, and nobody paid to be on it.
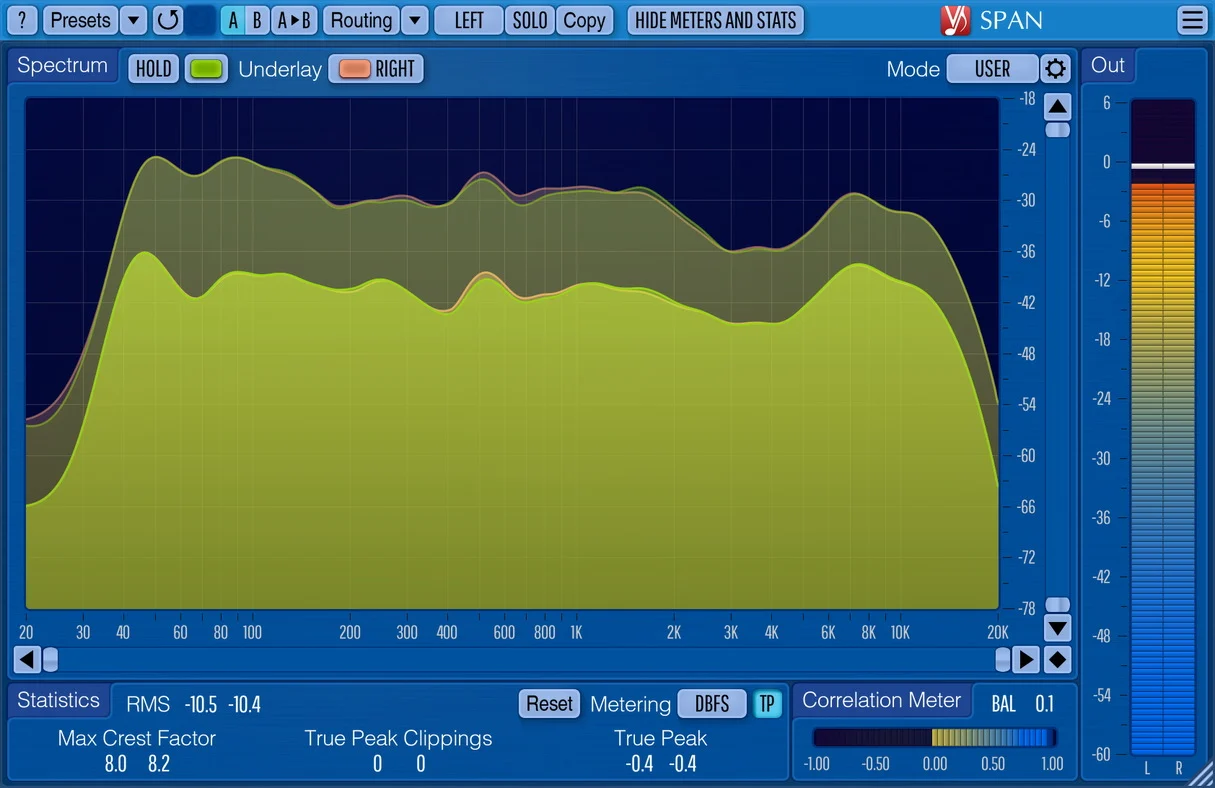
SPAN. Image: Voxengo 02SPANby Voxengo
FFT spectrum analyserBest for: The standard free analyser, with the deepest metering
SPAN has been the default free analyser for years, and for good reason. Its mode system sets the FFT block size, window overlap, slope, smoothing and a secondary curve (real-time or all-time maximum), and it can show two channels or channel groups at once in hosts that route them. Its metering goes further than anything else free: EBU R 128 and K-system scales with calibration, level statistics, crest factor, true-peak clipping and correlation. It also reads 5.1 and 7.1. SPAN Plus, a paid version, adds multi-track comparison.
Why pick it
- Every format, AAX included
- K-system, statistics and true-peak detection
- Surround analysis
Know first
- Comparing two tracks takes channel routing, and is easier in the paid SPAN Plus
- No idea of stereo position beyond correlation
Free · SPAN Plus, paid, adds more
Voxengo's page for SPAN (opens in a new tab)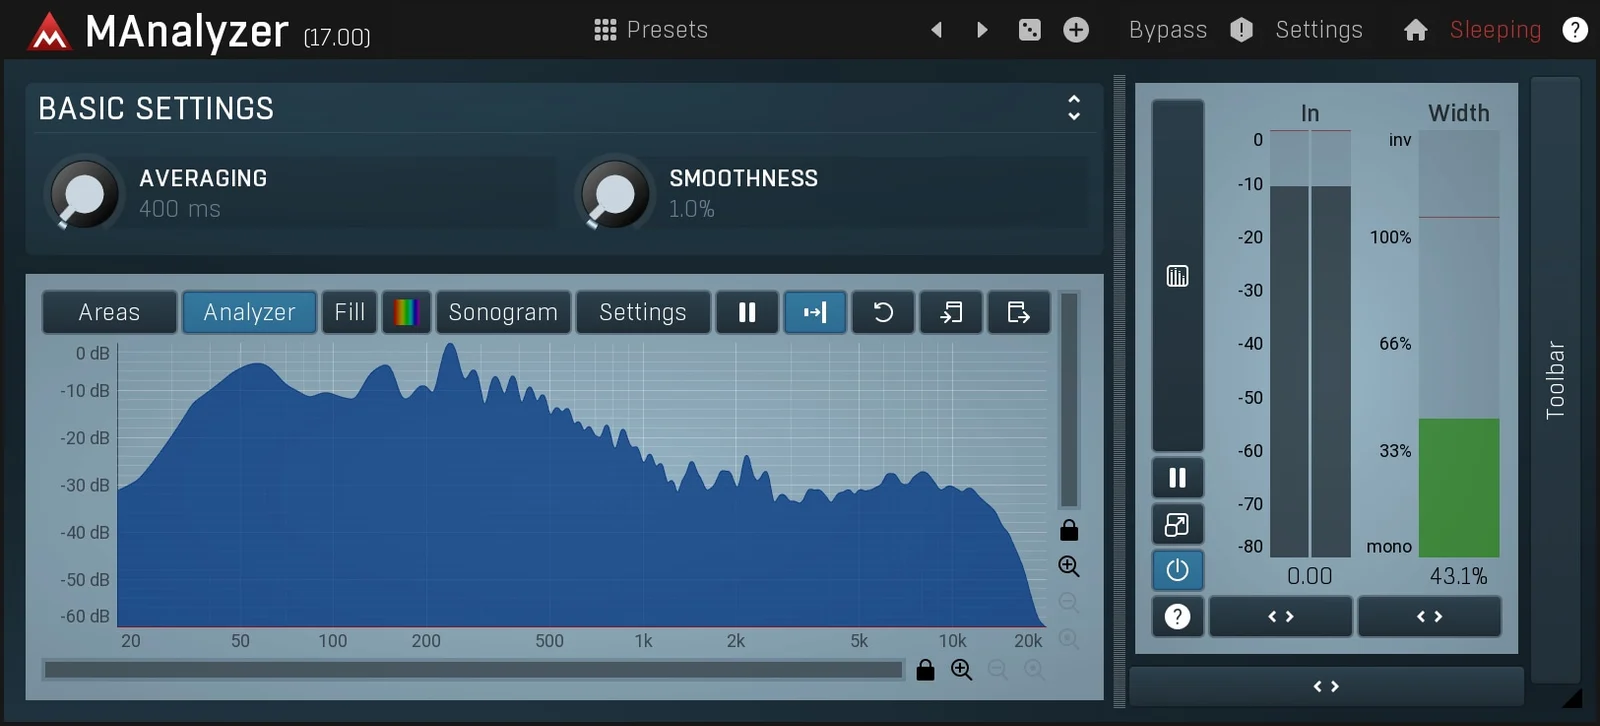
MAnalyzer. Image: MeldaProduction 03MAnalyzerby MeldaProduction
Spectrum analyser and sonogramBest for: Deep analysis options from a big free bundle
MAnalyzer comes in MeldaProduction’s free MFreeFXBundle, and brings Melda’s usual depth: averaging, smoothing, normalisation, super-resolution, prefiltering and a deharmonisation mode, with level and stereo width meters beside the spectrum. It has a sonogram view too, though full sonogram access in the bundle is one of the features of the paid upgrade.
Why pick it
- Unusual analysis modes
- Comes with dozens of other free effects
Know first
- A dense interface
- Some features need the paid upgrade
Free · In MFreeFXBundle; some extras need the paid upgrade
MeldaProduction's page for MAnalyzer (opens in a new tab)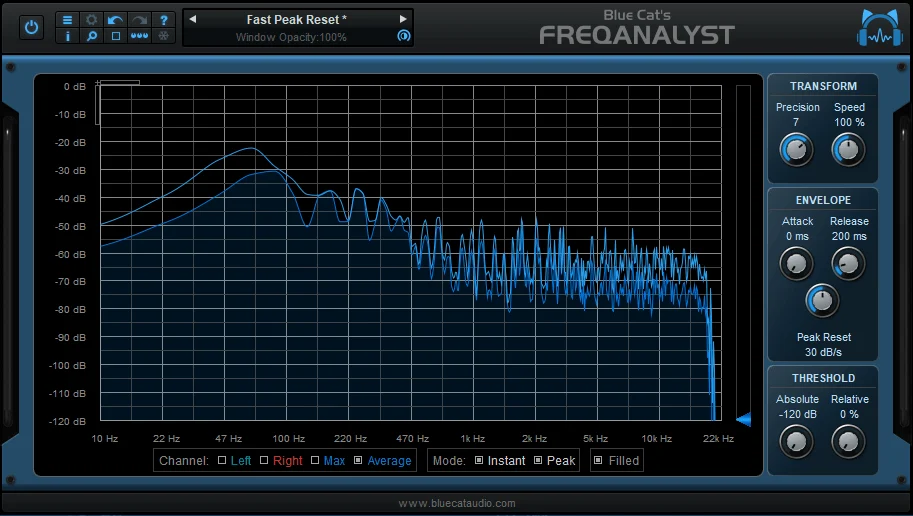
FreqAnalyst. Image: Blue Cat Audio 04FreqAnalystby Blue Cat Audio
Real-time spectrum analyserBest for: A simple, smooth spectrum with nothing to learn
FreqAnalyst does one thing: a smooth, high-resolution mono or stereo spectrum, with interpolation that keeps it readable even at fine frequency resolution, peak and average curves, and controls for speed and envelope. It takes seconds to set up. Blue Cat’s paid FreqAnalyst Pro adds measurement tools and a 3D spectrogram, and FreqAnalyst Multi compares tracks.
Why pick it
- Very easy to read
- Every format, AAX included
Know first
- One signal at a time
- No loudness metering
Free · FreqAnalyst Pro and Multi, paid, add more
Blue Cat Audio's page for FreqAnalyst (opens in a new tab)
Already in your DAW
Before installing anything, check what your DAW already has:
- Ableton Live: the Spectrum device, and the analyser in EQ Eight.
- Logic Pro: the analyser in Channel EQ, and MultiMeter for spectrum, correlation and loudness.
- FL Studio: Wave Candy, and the analyser in Parametric EQ 2.
- Cubase: SuperVision, a configurable set of meters and analysers.
- Studio One: Spectrum Meter, and the analyser in Pro EQ.
- Reaper: the analyser in ReaEQ, and the bundled JS spectrum analyser.
They are fine for finding a frequency. What they rarely do is compare two signals on one display, which is the job that makes an analyser most useful.
Settings that change what you see
Block size
An FFT splits the signal into bins spaced by the sample rate divided by the block size. At 48 kHz, a 2048-point block gives bins about 23 Hz apart, too coarse to separate two bass notes; 8192 points gives about 6 Hz. Larger blocks also respond more slowly, so use a large one for the low end and a mix, and a smaller one to watch transients.
Slope
Music has less energy as frequency rises, so an untilted analyser shows every mix falling away to the right. A slope of 3 dB per octave makes pink noise read flat; 4.5 dB per octave, a common default, makes a typical finished mix read roughly level. The slope changes nothing about the sound, only how easy the picture is to read.
Smoothing and speed
No smoothing shows every harmonic, which is right for finding one resonance. A third or a sixth of an octave shows tonal balance, which is right for comparing a mix with a reference. A slow fall speed or an average shows the long-term shape; a fast one shows what is happening now.
Reading it without fooling yourself
- Ears decide, the screen explains. If it sounds right and looks wrong, it is right. Use the analyser to find out why something sounds wrong.
- Compare at the same loudness. A louder reference looks fuller everywhere. Match them in LUFS before comparing their curves.
- A peak is not a problem. Every note is a peak. A resonance is a peak that stays put while the notes change.
- Overlap is not masking. Two tracks with energy at one frequency only hide each other if they also play at the same time and from the same place. Our frequency masking guide explains how to tell.
- Watch the mid and side separately. Low end in the side channel, or a vocal-range build-up in the middle, often explains a problem the stereo curve hides.
Questions
What is the best free spectrum analyser plugin?
Voxengo SPAN is the standard, with the deepest metering. Soap is the one to choose for comparing a track with the rest of the mix, since it shows where they overlap in frequency and in the stereo image and adds loudness and true-peak meters. Blue Cat's FreqAnalyst is the simplest to read.
What slope should I set on a spectrum analyser?
4.5 dB per octave is a common default: it makes a typical finished mix read roughly flat, so differences stand out. 3 dB per octave makes pink noise flat. The slope only changes the picture, never the sound.
What FFT size should I use?
8192 points is a good all-round choice at 44.1 or 48 kHz, separating frequencies about 5 to 6 Hz apart. Use 16384 for detail in the sub-bass, and 2048 or 4096 when you want the display to react quickly.
Can a spectrum analyser show frequency masking?
Only if it can show two signals at once, and even then overlapping curves are not proof of masking. Soap compares a track with the rest of the mix and marks a clash only where they share both a frequency and a place in the stereo image, which is closer to what you hear.